“The tools are not the problem. The gaps between them are.”
Capital project teams do not run on one tool. They run on a stack. Schedules live in one system, costs in another, field data in a third, and a few critical numbers live in a spreadsheet someone built years ago.
Every one of these tools is good at its own job. The trouble starts when leadership asks for a single report that pulls from all of them. This post walks through the 10 tools we see capital project teams relying on most in 2026, what each one does well, and where reporting gets difficult. The list is not a ranking. Most teams use several of these at once.
1. Oracle Primavera P6
P6 is still the standard for scheduling on large capital projects. It handles thousands of activities, complex logic, and multiple calendars better than almost anything else. For reporting, the challenge is that the data is structured for scheduling and not for dashboards. Getting clean schedule data out of P6 and into a reporting tool takes real work.
2. Microsoft Power BI
Power BI is the reporting layer for a large share of capital project teams. It connects to many data sources, it is familiar to people already working in Microsoft tools, and it can serve project teams and executives from the same data. Its strength depends entirely on the data model behind it. A dashboard built on messy data looks good and says very little.
3. Procore
Procore is where a lot of field and project management work happens. RFIs, submittals, daily logs, and cost tracking all live here for many contractors and owners. It has its own reporting, which works well for operational questions. Teams that need schedule, cost, and procurement in one view usually need to bring Procore data together with other systems.
4. InEight
InEight is built for large capital programs and covers estimating, cost control, scheduling, and progress. Teams that adopt it get a lot of project controls depth in one place. Like any large system, it still sits next to other tools, so enterprise reporting often means combining its data with P6, ERP, and field systems.
5. Oracle Primavera Unifier
Unifier handles cost, contracts, change management, and workflows for owners running capital programs. It is strong at governance and approvals. Pairing its cost data with schedule data from P6 in a consistent reporting view is one of the most common integration needs we see.
6. Kahua
Kahua is popular with owners who want configurable workflows across a portfolio of projects. It centralizes program governance, documents, and cost tracking. Teams using it often still want a separate executive reporting layer that pulls in data from outside Kahua.
7. Hexagon EcoSys
EcoSys focuses on budgeting, forecasting, and cost control across many projects at once. It is a good fit for enterprise programs that need a consistent financial view. Reporting questions usually come up when that financial view has to line up with schedule progress.
8. Microsoft Excel
Excel is still everywhere, and honestly it belongs on this list. Subcontractors send progress in Excel. Analysts build forecasts in Excel. Cost trackers live in Excel. It is flexible and everyone knows it. The cost is that every spreadsheet is a separate version of the truth that someone has to reconcile by hand.
9. Schedule Validator
Schedule Validator is a cloud tool that checks the quality of project schedules. A team uploads a P6, MS Project, or Asta Powerproject file and gets a validation score, a list of issues to fix, and critical path analysis within minutes. It also compares one schedule update to the next, which helps owners and executives spot schedules that may be hiding delays. With more than 250,000 schedules analyzed and over 150 enterprise customers, it has become a go to for teams that want to trust the plan they are reporting against. Its score becomes even more useful when it sits next to cost and procurement data.
10. Queryon ONE
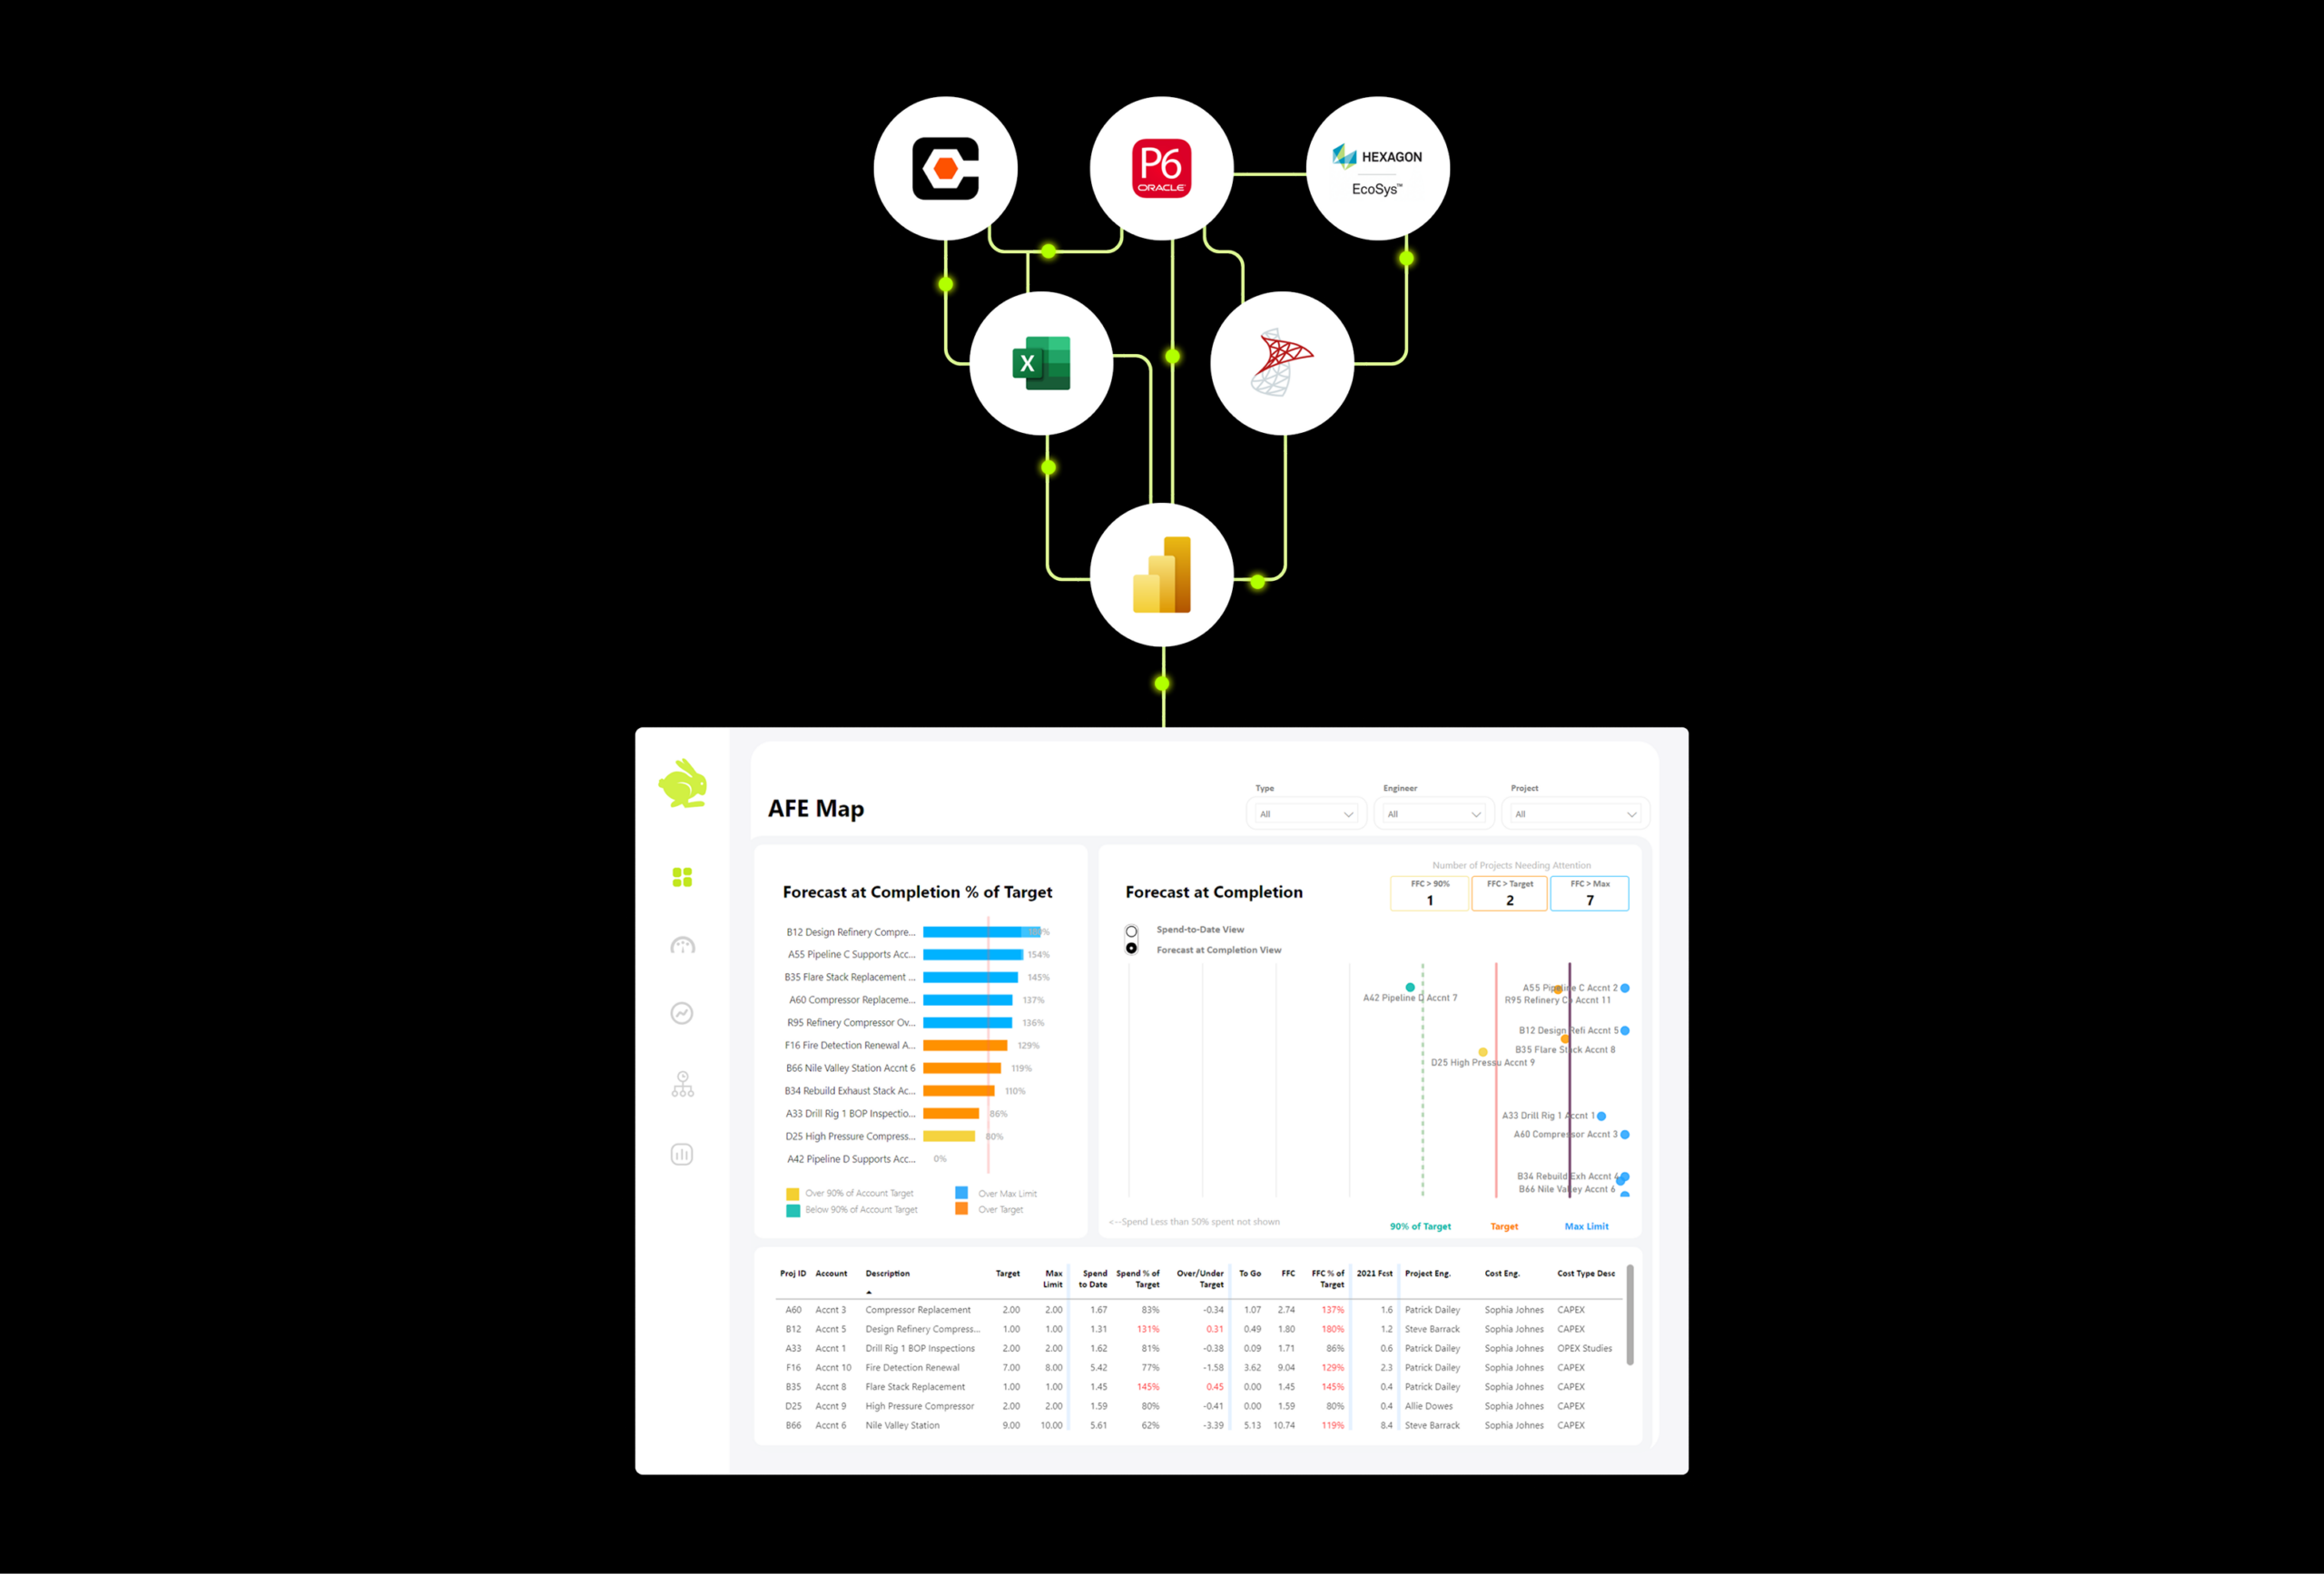
Queryon ONE is the software we built ourselves for project controls professionals who spend too much time gathering and cleaning data. It takes schedule, cost, and risk data from sources like P6, Procore, Excel, and PDFs, brings it together into one consistent model, and delivers clean results to Power BI, Excel, and AI chat. Instead of rebuilding a report by hand every cycle, a team can ask questions of their data and get answers they can trace back to the source. It is designed for smaller, focused teams that want to get started quickly, and it can also pull in the Schedule Validator score so schedule quality sits alongside cost and procurement in one place.
The Real Problem Sits Between the Tools
Look at that list again. Every tool does its own job well. Most of them were not built to give an executive one consistent view across all the others.
That is why reporting still takes days on many programs. Someone exports from P6, someone else pulls costs from the ERP, a third person collects Excel files from the field, and then all of it gets stitched together by hand. The numbers are already old by the time the report goes out, and nobody is fully sure they are right.
Adding another tool does not fix this on its own. What fixes it is connecting the tools you already have into one trusted source of information.
How Queryon Connects the Tools You Already Use
Queryon is a capital project analytics and consulting firm. We work with construction and energy teams to bring data from tools like P6, Procore, InEight, Kahua, Microsoft, Databricks, and ERP systems into one reporting environment.
We start by understanding where your data lives and what leadership needs to see. Then we build the data foundation, the automated connections between systems, and the Power BI reporting on top. The result is a view of cost, schedule, forecast, and risk that updates on its own and that your team can stand behind.
We also believe you should own what we build. Whether Queryon stays on as a partner or hands the system to your internal team, the information and the reporting belong to you.
Want One View Across Your Tools?
If your team is working across several of these tools and still building reports by hand, we would be glad to talk through what a connected setup could look like for your program.