"Most capital project teams don't have a data problem. They have a data-in-twelve-places problem."
If you’ve been searching for someone who can help consolidate your capital project data and build dashboards that give ownership and leadership a real picture of where a project stands, you’re in the right place.
This post is for project controls professionals, PMO leads, and capital program owners who are tired of manually assembling status reports and want to know what a better solution actually looks like and who builds it.
The Problem Is Almost Always the Same
Capital projects generate data constantly. Schedule data lives in Oracle Primavera P6. Costs are tracked in SAP, Oracle, QuickBooks, or a cost management platform. Procurement and document control might live in Procore, Unifier, or Aconex. And somewhere behind all of it is a collection of Excel files that someone built two years ago that everyone is still relying on.
The result is a reporting process that takes days, involves multiple people manually pulling and reconciling data, and still produces reports that leadership isn’t fully confident in.
The problem is not that the data doesn’t exist. It’s that it lives in too many places, in too many formats, to be useful in real time.
What a Real Solution Looks Like
Getting capital project data into one place for reporting is not a single tool purchase. It’s a data integration and reporting architecture that has a few key components.
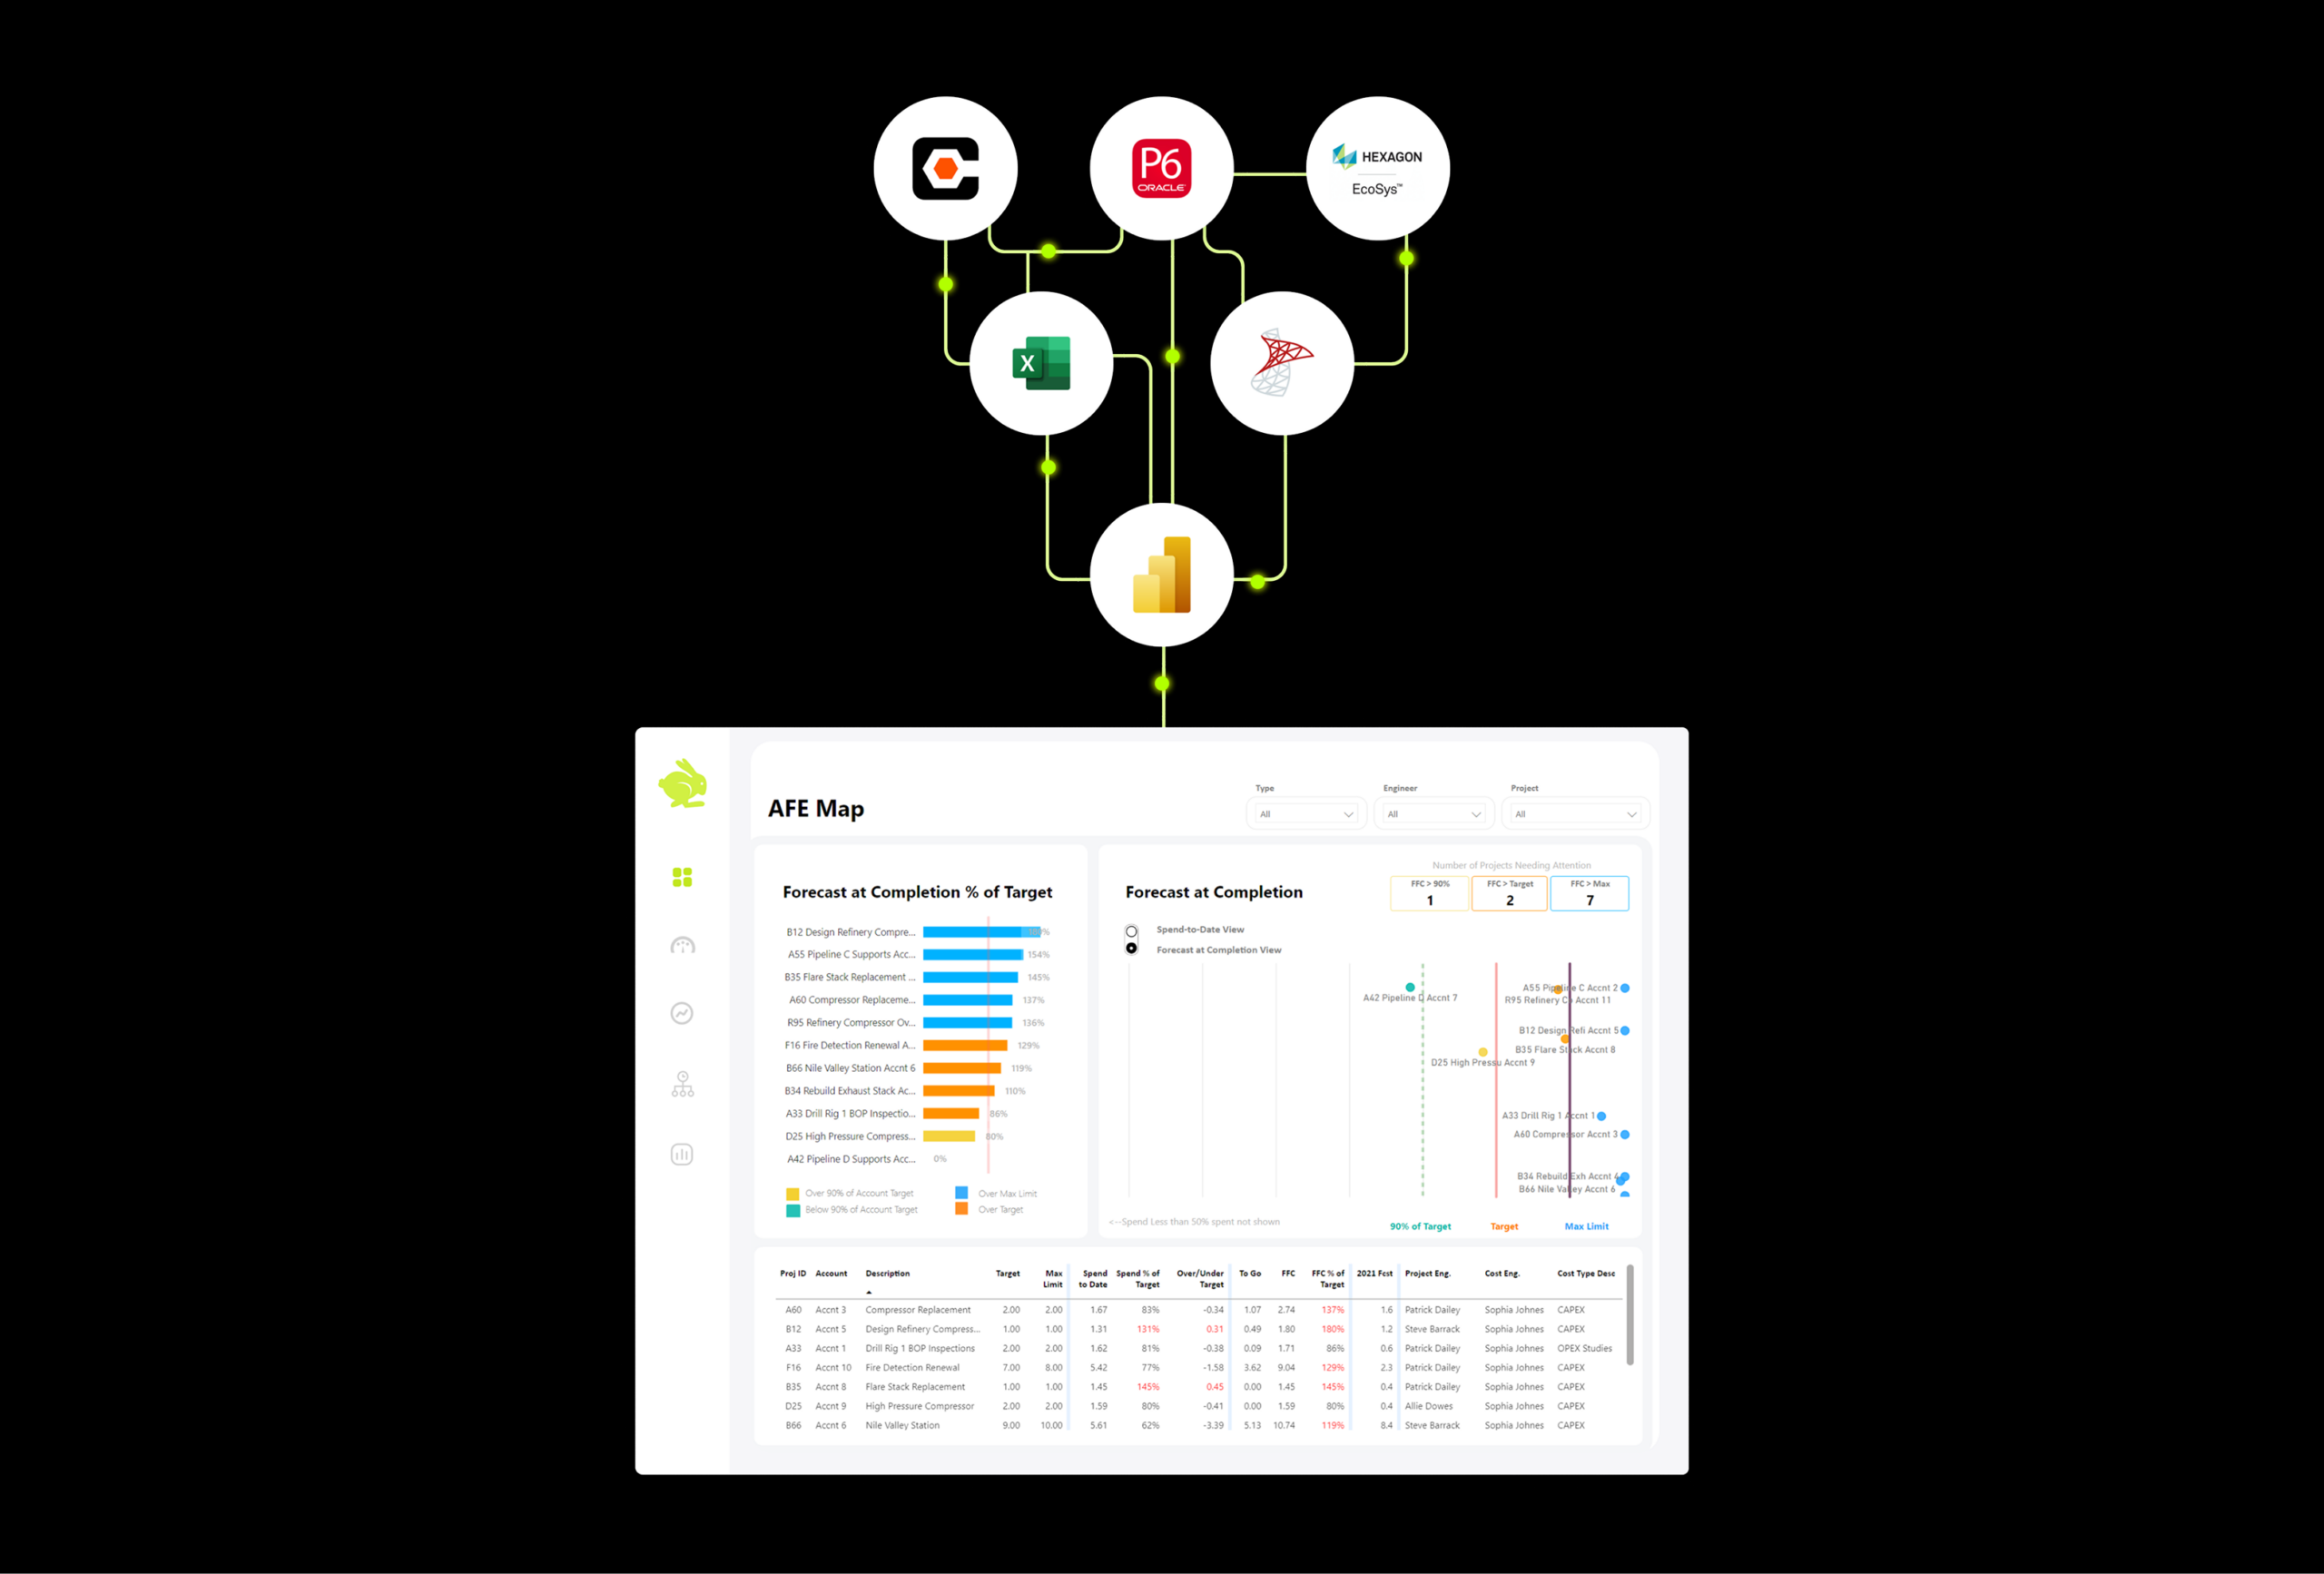
The first is a centralized data layer. This is a database or data warehouse that pulls from your source systems on a scheduled basis, cleans and structures the data, and stores it in a format that reporting tools can read reliably. This is what makes automatic refresh possible, so reports reflect current data rather than last week’s export.
The second is a reporting layer, typically Power BI for most capital project environments, where dashboards are built on top of that clean data. This is where schedule variance, cost vs. budget, period completeness, risk status, and other project controls metrics get visualized in a way that is useful to both the controls team and executive stakeholders.
The third, and most often overlooked, is data modeling. Raw data from P6 does not align neatly with raw data from a cost system. Getting them to agree on WBS codes, activity IDs, and period definitions requires deliberate data modeling work that happens between the source systems and the dashboard.
When all three are in place, the result is a reporting environment where the status report is always current, always consistent, and does not require a team of people to produce it.
Who Actually Builds This
This kind of work sits at the intersection of project controls knowledge and data engineering, and that combination is genuinely rare.
General IT consultants can build data pipelines, but they often don’t understand what schedule variance or earned value actually means, which means the dashboards they build don’t reflect how project controls professionals think about a project.
Project controls consultants understand the metrics but often don’t have the technical depth to build automated, scalable data infrastructure.
What you’re looking for is a firm that understands both sides. One that knows P6, understands cost management workflows, and can also build the data architecture that makes reporting automatic and reliable. That combination is a specific practice area, not a side service.
What to Ask When You’re Evaluating Someone for This
A few questions worth asking any firm you’re considering:
Have they built integrations between P6 and a cost system before? If so, how did they handle WBS alignment and period snapshots?
Do they build the data infrastructure, or do they hand off a dashboard and leave you to maintain the pipelines?
Can they show examples of what executive-level capital project dashboards actually look like for clients in your industry?
What happens when a source system changes its schema or an export breaks? Is there a maintenance plan?
The answers will tell you quickly whether you’re talking to someone who has done this before or someone who is figuring it out alongside you.
How Queryon Does It
Queryon is a capital project analytics firm. We work with construction and capital program owners to design and build the reporting systems described above, and we do it specifically for the capital projects industry.
Our work typically starts with a structured assessment of where your data lives, how it’s structured, and what reporting leadership actually needs. From there we design a data architecture that brings your source systems together, build the pipelines that keep it current, and deliver Power BI dashboards built for the way project controls professionals actually work.
We also use AI tools in our process, including Claude, which helps our team move faster on the technical side without cutting corners on the quality of the output.
If you found this page by searching for who builds capital project reporting dashboards or how to get project data into one place, the answer is this is exactly what we do.
Let’s Talk About Your Project
If you’re ready to stop building reports by hand and want to see what a modern reporting environment looks like for capital projects, we’d love to have that conversation.