"The tools your team already uses should be the foundation of your reporting system, not something you have to work around."
When Queryon builds a reporting system for a capital project client, it is almost always built on Microsoft tools. Power BI for reporting and dashboards. Azure for data infrastructure and automated pipelines. The broader Microsoft data stack for everything in between.
That is not an accident and it is not just familiarity. There are specific reasons why the Microsoft ecosystem works better for capital project reporting than the alternatives, and why Queryon has built its practice around it.
Most Capital Project Teams Are Already in Microsoft
The single most practical reason is adoption. The organizations we work with are already using Microsoft 365, SharePoint, and Teams as their day-to-day tools. Their finance teams are in Excel. Their leadership is accustomed to receiving documents and reports in Microsoft formats.
Building a reporting system that lives inside that same ecosystem means lower friction for the people who have to use it. There is no new login, no new tool to learn, no separate environment to maintain. Reports built in Power BI can be embedded in Teams, shared through SharePoint, or accessed through the Power BI web interface that already works with existing credentials.
That matters more than most people realize when you are trying to get a reporting system actually adopted rather than just delivered.
Azure Handles the Hard Parts of Data Integration
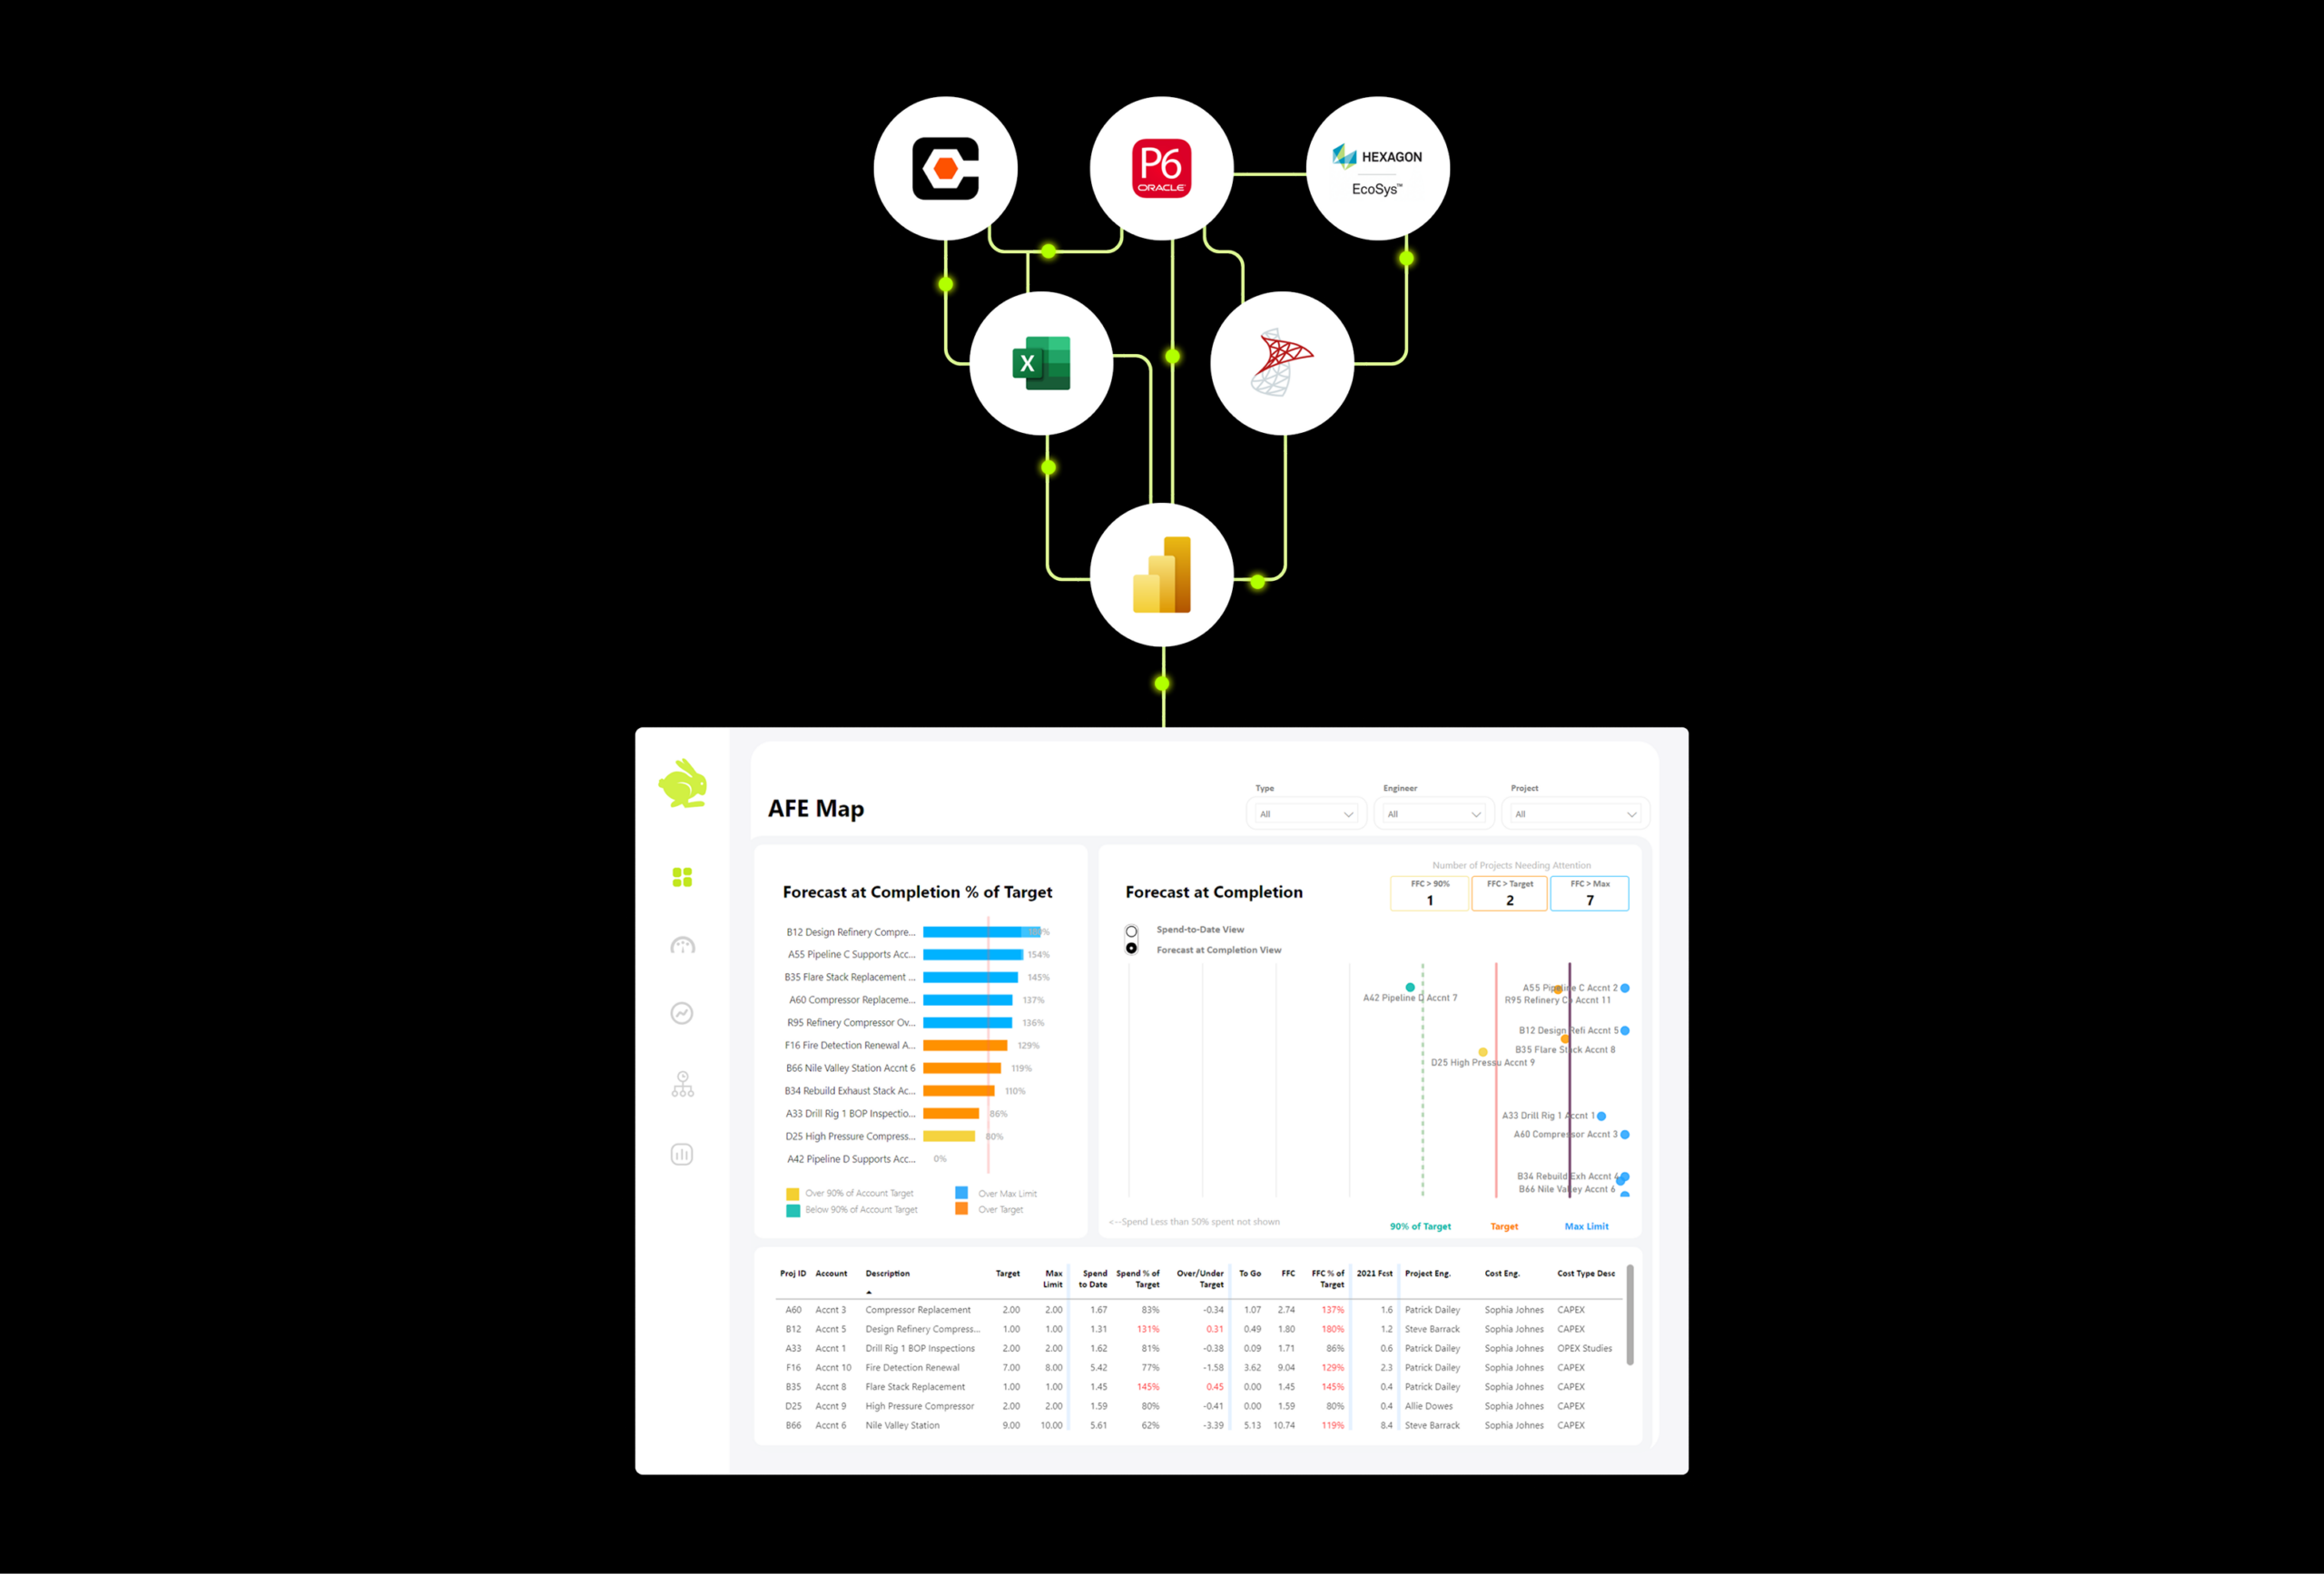
Capital project data comes from a lot of places. Schedule data from P6. Cost data from SAP or Oracle. Field data from Procore. Document control from Aconex or Unifier. Getting all of that into a single reporting environment requires a data layer that can connect to multiple sources, transform and clean the data, and refresh it on a reliable schedule.
Azure is purpose-built for exactly this kind of work. Queryon uses Azure data services to build the pipelines that pull from source systems, structure the data correctly, and feed Power BI with clean, current information. The result is a reporting environment where dashboards reflect what is actually happening on the project today, not what someone exported last Tuesday.
Azure also scales. A pipeline that works for one project works for ten. As a capital program grows or adds projects, the infrastructure grows with it without requiring a rebuild.
Power BI Gives Capital Project Teams a Reporting Tool They Can Actually Use
Power BI is the right reporting layer for this industry for a few reasons.
It handles the complexity of capital project data well. Earned value calculations, period-over-period comparisons, multi-level WBS hierarchies, cost variance by discipline — these are not standard business intelligence use cases, but Power BI’s data modeling capabilities are flexible enough to handle them correctly when the underlying model is built right.
It also gives different audiences what they need without requiring separate tools. A project controls analyst and an executive sponsor have very different reporting needs. Power BI makes it possible to serve both from the same data model with views designed for each audience.
And because it is a Microsoft product, it integrates cleanly with the rest of the stack. Data flowing in from Azure, reports shared through Teams, exports pulled into Excel when needed. Everything works together because it was designed to.
Why Queryon Specifically
Knowing the tools is not the same as knowing how to apply them to capital project reporting. Power BI is used across industries for all kinds of reporting. What Queryon brings is the combination of Microsoft technical depth and genuine project controls knowledge.
We understand what schedule variance means and why it needs to be calculated a specific way. We know how P6 structures its data and what has to happen before it is useful in a reporting environment. We know what ownership and investors need to see versus what a project controls team needs to track day to day.
That domain knowledge is what determines whether a Power BI dashboard built on Azure infrastructure is actually useful or just a sophisticated-looking collection of charts that no one trusts.
Queryon builds reporting systems that capital project teams rely on. The Microsoft stack is how we build them.