Power BI Analytics for Construction

Our Power BI solutions integrate all your Excel data, Procore, and Oracle Primavera, bringing all your data sources into one place. Gain insights, forecast trends, manage costs, and optimize your projects efficiently with real-time analytics tailored for the construction industry.
Sign up now to view our demo:

10+ Years Service

Top 5% Experts

Artificial Intelligence

Construction

Trusted by partners you know

Access all your data in one platform.

Queryon supports 200+ integrations, so you can have one single source of truth all in one platform.

Data insights at your fingertips

 Automated Financial Reporting

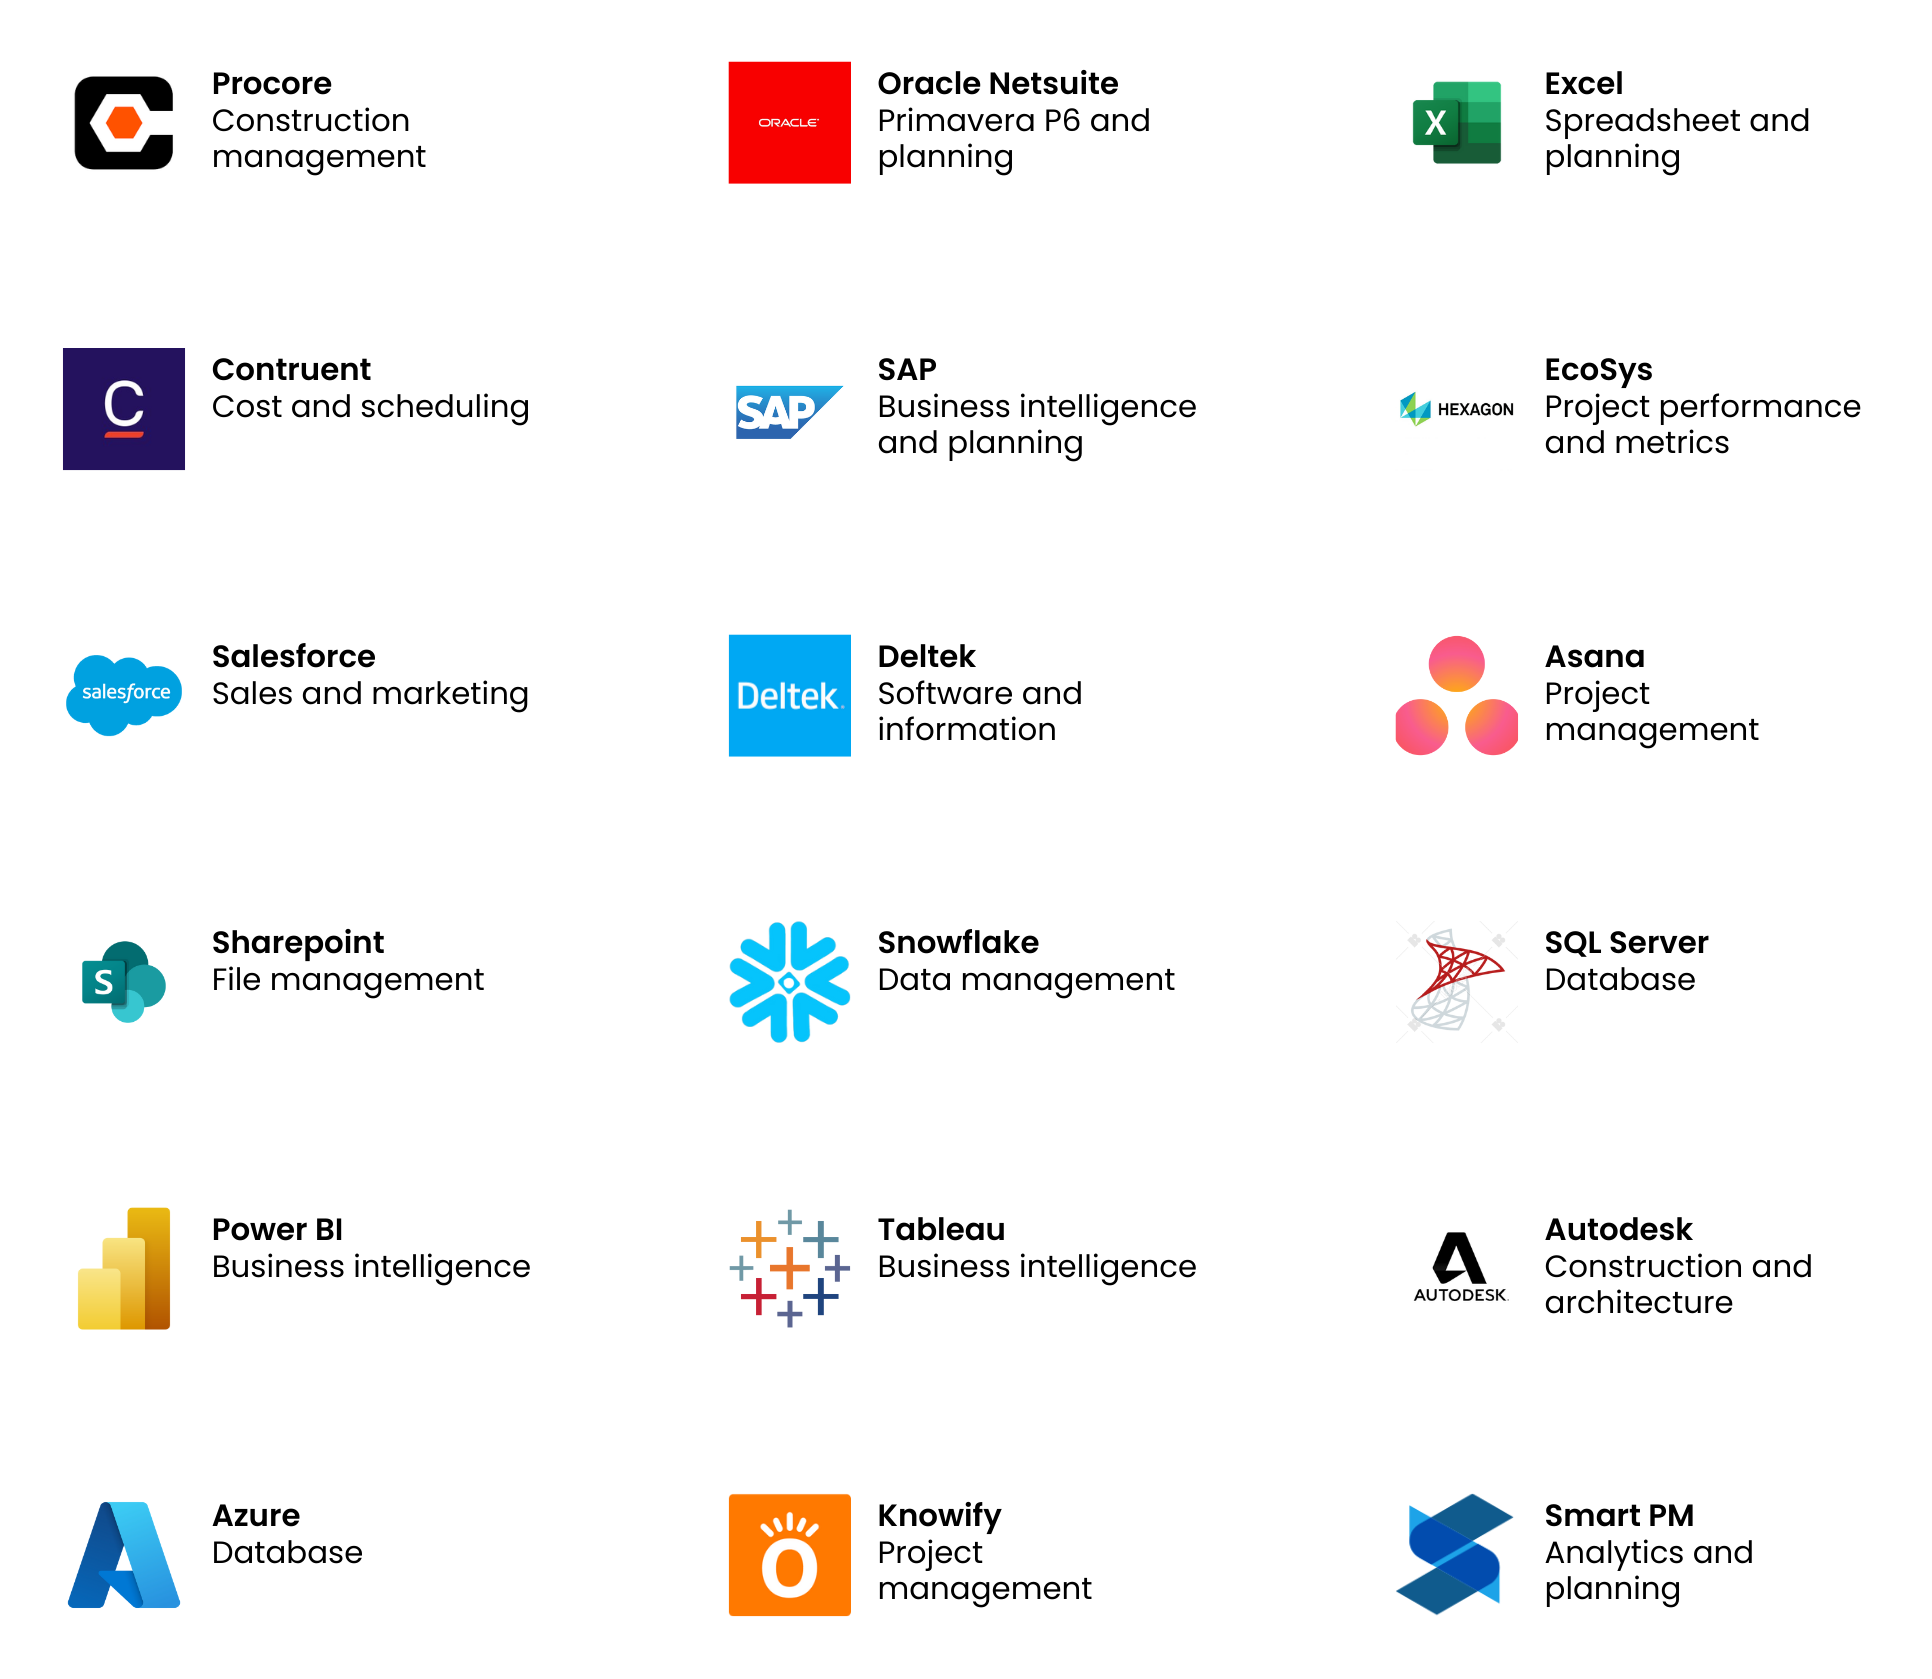
Streamline monthly financial reports by automatically pulling data from multiple sources like Procore and Oracle Primavera, reducing manual entry and increasing accuracy.

 Cost Tracking and Budget Management

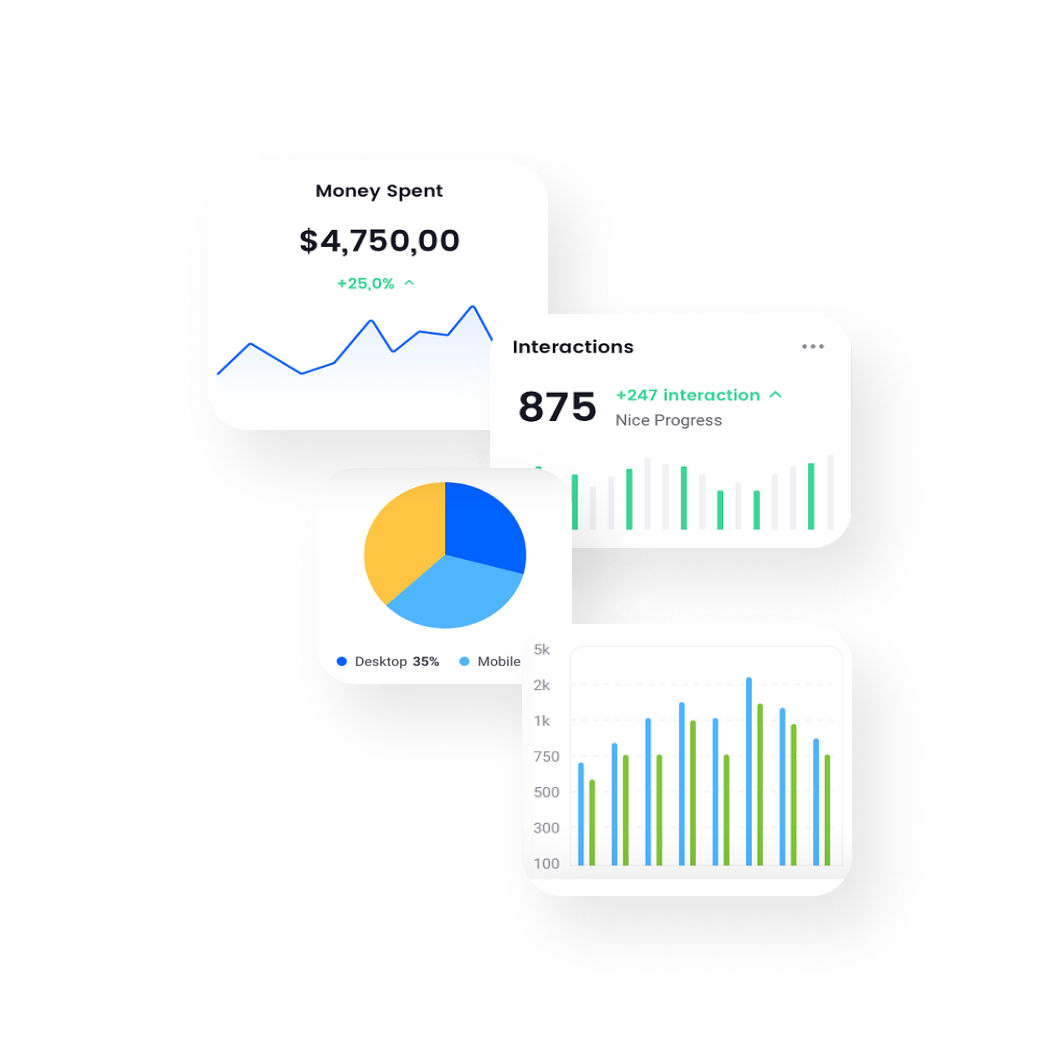
Monitor project expenses in real-time, track budget usage, and forecast future costs with interactive dashboards tailored to construction financials.


 Trend Analysis and Forecasting

Visualize key financial trends over time and use predictive analytics to forecast cash flow, ensuring proactive management of construction budgets and resources.

ROI

“Companies that use data to drive their decisions see an average of 26% increase in ROI”

McKinsey & Company

Award Winning Design

When it comes to data visualization, design matters, and we lead the industry in delivering beautiful, functional solutions that set you apart.

Construction Solutions

What is Construction Data Analytics?

Construction data analytics involves turning raw operational data into meaningful insights that streamline project management, cost tracking, and reporting. Many construction firms export data from platforms like Procore into Excel for monthly reporting. However, we take it further by setting up live connections that automatically update your data daily within a Power BI dashboard. This enables real-time visibility and improved decision-making across all your construction projects.


Our Capabilities

We specialize in building custom Power BI solutions for construction companies, providing seamless integration with Procore, Oracle Primavera, and other essential data sources. Our solutions offer automated financial reporting, cost tracking, and trend analysis, ensuring you can visualize and manage your operations efficiently. By transforming your Excel-based reporting into dynamic, real-time dashboards, we empower your team to track progress, manage costs, and forecast accurately, all within a single platform tailored to your needs.

Step 1: Discovery

Define requirements

Meet with the business, marketing, and data teams to define business and reporting objectives and better understand each stakeholder's requirements and the overall business intelligence operations.

Data infrastructure

Data infrastructure assessment, cloud architecture design, implementation, and data integrations is our expertise. We will review your data infrastructure to ensure the right foundations are in place for success.

Data audit

We will audit your data collection, pipelines, and integrations to ensure they collect, extract, transform, and load accurate data of the metrics that matter to your business needs. We will also ensure it can be used to deliver your data visualizations and dashboard needs.

Step 2: Design & Develop

Wireframe & visuals

We define the information architecture and create wireframes and flowcharts for all the dashboards' graphs, dimensions, and metrics. We will also define data manipulations, calculations, API integrations, connectors, and engineering specifications.

Data preparation

We set up or prepare the Data Warehouse, create the API integrations with third-party platforms, and load the data into the warehouse tables. This includes review and mapping compatibility & comparability of dimensions and metrics across platforms.

Data engineering

Using detailed specifications that include wireframes, schematics, data integrations, pipelines, and data flows, we will rewrite or merge data, create calculations, build SQL queries and QA, or validate the data. We provide a data glossary & full training.

Step 3: Implement & Support

Implementation

Power BI implementation, setting it up in your infrastructure to ensure seamless integration with your existing systems. From deployment to configuration, we build a robust environment designed to empower your business with real-time insights.

Training

Power BI training tailored to your team’s unique needs, ensuring full adoption and ease of use. Our experts guide your team through every step, helping them understand how to analyze data, create reports, and make data-driven decisions with confidence.

Support

We provide fractional analytics and business intelligence teams that cover the entire data lifecycle, from strategy, collection, engineering, privacy, analysis, insights, and activation. Gain a dedicated team at a fraction of the cost of hiring.

What are others saying?

"Queryon transformed our data management process, providing insightful dashboards that provide a singular source of truth."
Jonathon Canon
Good360
"Exceptional expertise and seamless integration – Queryon delivered beyond our expectations for our data projects in both project and progress data."
Tonya White
Santos
"Efficient, effective, and invaluable – Queryon's data solutions elevated our business to new heights and streamlines our operations process for reporting."
Kevin Dejong
MWH

Are you getting the most out of your data? Let's chat!

Have questions or need assistance? We’re here to help! Whether you’re interested in our services, need support, or just want to learn more about what we do, please fill out the form below. Our team will get back to you promptly.

Let's connect

Ready to simplify your data challenges? Get in touch to see how we can help!