Power of the Annotated Bar
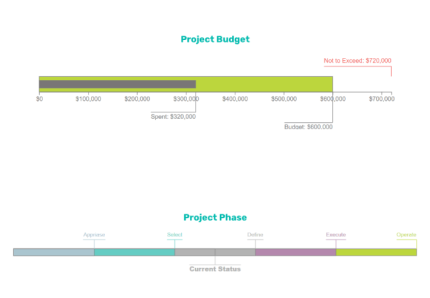
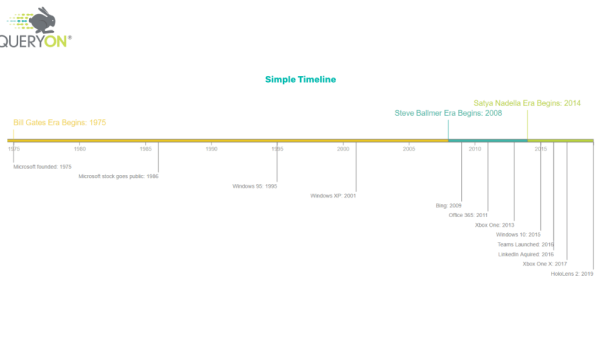
Experience unparalleled clarity and insight with Annotated Bar by Queryon, our Power BI visual that combines bar chart functionality with customizable labels. Designed to enhance your data visualization, Annotated Bar allows you to focus on key data points, compare metrics, and track progress towards goals in a visually appealing and easy-to-understand format.

Customization and Flexibility
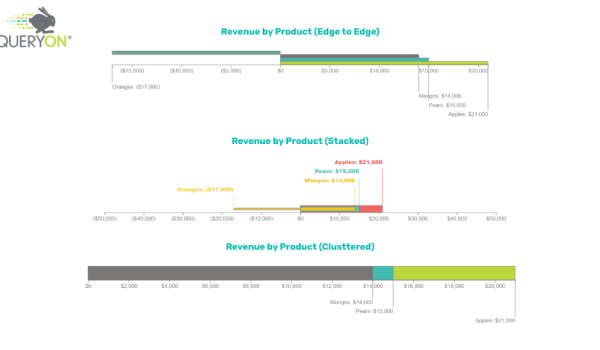
Unlock the full potential of your bar charts with extensive customization options in Annotated Bar by Queryon. Adjust label colors, fonts, sizes, and positions to create a visually striking chart that captures your audience’s attention. Dive deeper into your data with interactive drill-down features by clicking on labels or bars. Choose from stacked, side-by-side (clustered), and overlapping bar styles to craft the perfect visualization for your unique needs.

Download Annotated Bar
Version 1.0.7 is available on AppSource, offering a seamless experience that adheres to Microsoft certification requirements.
For those seeking the flexibility of using URL images in their Annotated Bar, download Version 1.0.7 directly from Queryon. This version supports URL images, providing additional customization options for your visualizations.

Contribute to Our Open Source Journey
At Queryon, we believe in the power of collaboration and innovation. That’s why Annotated Bar by Queryon is an open-source project, inviting developers, data enthusiasts, and users alike to contribute to its growth and enhancement. By working together, we can refine the visual’s capabilities, share ideas, and address challenges faced by users worldwide. Your contributions will help shape the future of the Annotated Bar, making it an even more powerful and versatile tool for data visualization. Let’s join forces and create something extraordinary!


