Power BI isn’t just a data visualization tool; it’s a transformative solution that helps businesses unlock the full potential of their data.
In today’s data-driven world, effective decision-making hinges on the ability to analyze, understand, and communicate complex data. Microsoft Power BI has emerged as a leading tool for data visualization, offering businesses the ability to turn raw data into actionable insights through stunning and interactive dashboards. Whether you’re managing projects in construction, tracking financial performance, or overseeing operations in manufacturing, Power BI delivers a comprehensive suite of features to meet your data visualization needs.
Here’s a closer look at the key benefits of using Power BI for data visualization:
1. Intuitive and Interactive Dashboards
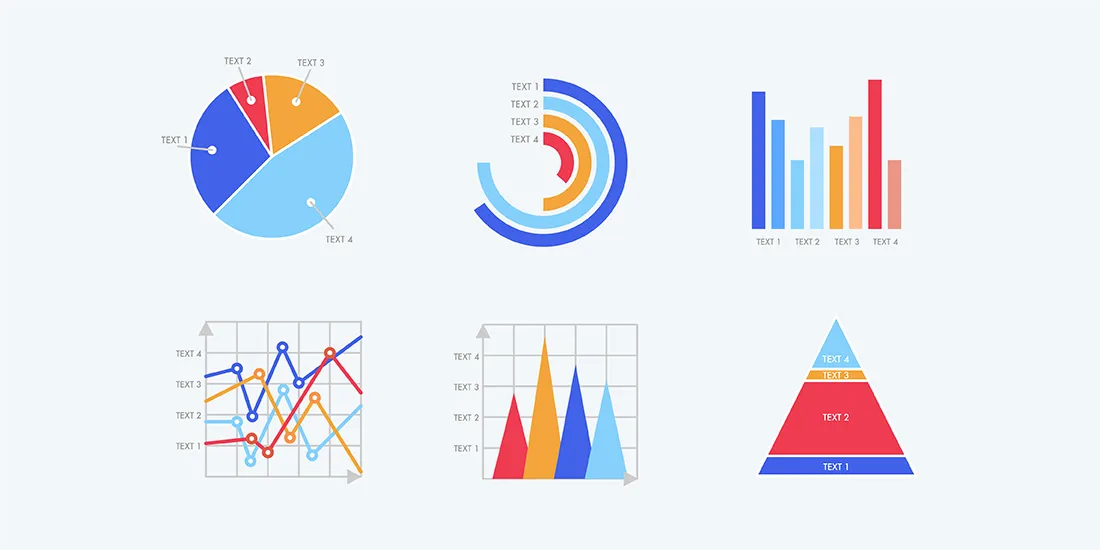
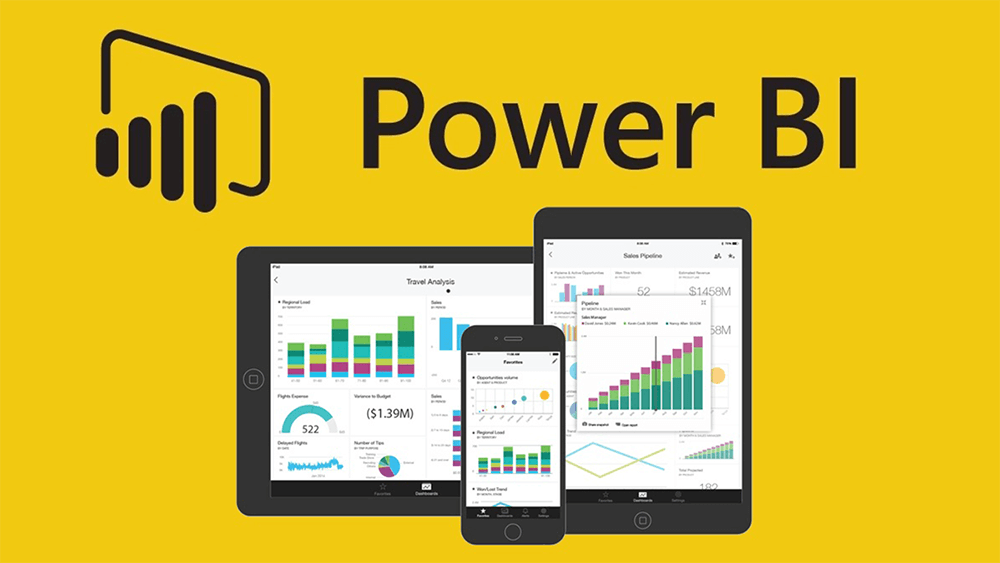
Power BI’s interactive dashboards allow users to explore data with ease. Its drag-and-drop functionality lets you create visually engaging charts, graphs, and maps in minutes. Unlike static spreadsheets or reports, Power BI’s visuals can adapt in real-time as you filter, drill down, or zoom into data, providing a deeper level of insight and exploration.
Example Use Case:
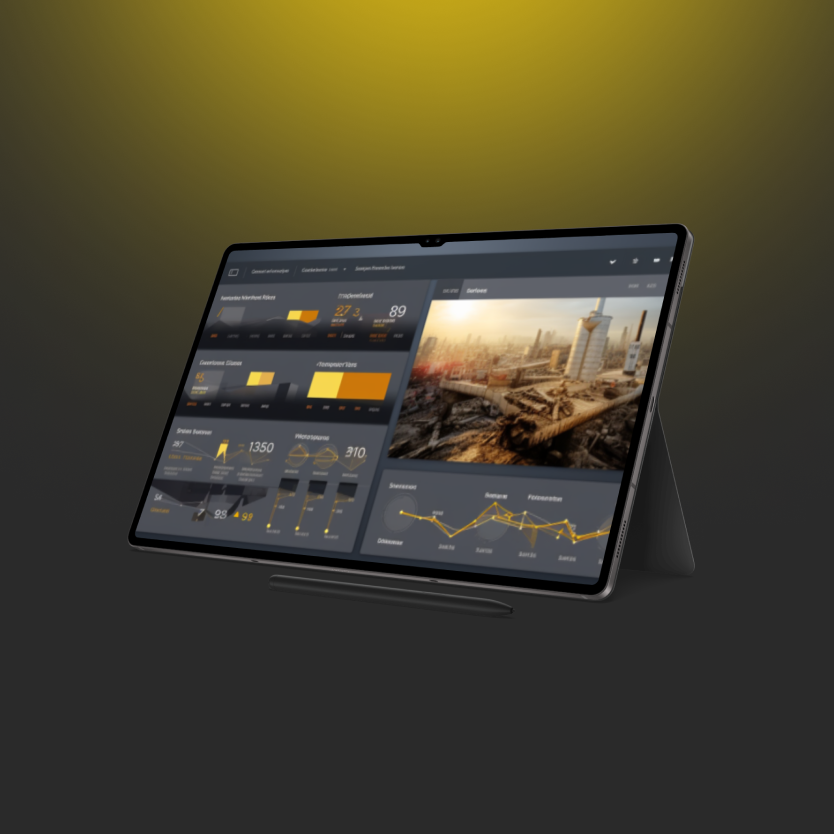
In the construction industry, project managers can use Power BI to visualize budget utilization, project timelines, and risk factors on a single, interactive dashboard. This enables them to make quick, informed decisions.
2. Real-Time Data Insights
One of Power BI’s standout features is its ability to process and display real-time data. This is particularly valuable for businesses that need up-to-date metrics to monitor progress, track KPIs, or adjust strategies dynamically.
Example Use Case:
Oil and gas companies can monitor equipment performance and field operations in real-time, reducing downtime and optimizing productivity.
3. Seamless Integration with Multiple Data Sources
Power BI integrates seamlessly with hundreds of data sources, including Excel, SQL Server, Oracle, Procore, and Salesforce. By consolidating data from disparate systems into a single dashboard, Power BI eliminates data silos and offers a holistic view of operations.
Example Use Case:
Manufacturing companies can combine data from ERP systems, production logs, and inventory databases into a unified report to streamline supply chain management.

4. Enhanced Collaboration and Accessibility
Power BI is built for collaboration. Its cloud-based platform allows users to share reports and dashboards securely with team members, stakeholders, and executives. Accessible from desktop, tablet, or mobile devices, Power BI ensures that key insights are always within reach.
Example Use Case:
Financial controllers in construction firms can share project forecasting dashboards with stakeholders, ensuring transparency and alignment across teams.
5. Advanced AI and Predictive Analytics
With built-in AI capabilities, Power BI allows users to identify trends, uncover hidden patterns, and make predictions based on historical data. This elevates data visualization beyond descriptive analytics into the realm of predictive and prescriptive analytics.
Example Use Case:
A risk analyst can use Power BI’s AI features to predict potential project delays based on historical scheduling data, helping teams proactively mitigate risks.
6. Scalability and Cost-Effectiveness
Power BI is designed to scale with your business. From small teams to enterprise-level organizations, its tiered pricing model ensures accessibility for all. Compared to traditional BI tools, Power BI offers powerful features at a fraction of the cost, making it a cost-effective choice for businesses of all sizes.
Example Use Case:
A growing manufacturing company can start with Power BI’s basic tools and scale up to more advanced features as their data needs evolve.
7. Data Security and Governance
With robust security features, including row-level security, Power BI ensures that sensitive data is protected. Organizations can control access to data at a granular level, maintaining compliance with industry regulations and internal policies.
Example Use Case:
A global energy company can use Power BI to ensure that each regional office only accesses relevant data, safeguarding confidential information.
Why Power BI is the Right Choice for Your Business
Power BI isn’t just a data visualization tool; it’s a transformative solution that helps businesses unlock the full potential of their data. By integrating data from multiple sources, enabling real-time insights, and fostering collaboration, Power BI empowers organizations to make data-driven decisions that lead to tangible results.
Whether you’re in construction, manufacturing, oil & gas, or any other data-intensive industry, Power BI offers the tools you need to stay ahead of the competition. At Queryon, we specialize in designing custom Power BI solutions tailored to your unique challenges and goals.
Ready to Harness the Power of Your Data?
Contact us today for a free consultation and discover how Power BI can revolutionize your data visualization and reporting processes.


